|
|
| Line 1: |
Line 1: |
| | | | |
| − | {| border="0" align="right" cellspacing="1" cellpadding="5" style="width: 400px; font-size: 14px" | + | {| border="0" align="right" cellspacing="1" cellpadding="5" style="width: 400px; font-size: 14px" |
| | |- | | |- |
| − | ! scope="col" colspan="4" style="width: 602px; text-align: center; background-color: rgb(79, 129, 189)" | <font color="#ffffff"><span style="line-height: 20px">Republic of India</span></font> | + | ! scope="col" colspan="4" style="width: 602px; text-align: center; background-color: rgb(79, 129, 189)" | <font color="#ffffff"><span style="line-height: 20px">Republic of India</span></font> |
| | |- | | |- |
| − | | colspan="3" rowspan="1" style="width: 250px; text-align: center; background-color: rgb(219, 229, 241)" | [[File:Flag of India svg.png|center|180px|Flag of India|alt=Flag of _____.png]] | + | | colspan="3" rowspan="1" style="width: 250px; text-align: center; background-color: rgb(219, 229, 241)" | [[File:Flag of India svg.png|center|180px|Flag of India|alt=Flag of _____.png]] |
| − | | style="width: 250px; text-align: center; background-color: rgb(219, 229, 241)" | [[File:India (orthographic projection).svg|center|180px|India Location|alt=Location _______.png]] | + | | style="width: 250px; text-align: center; background-color: rgb(219, 229, 241)" | [[File:India (orthographic projection).svg|center|180px|India Location|alt=Location _______.png]] |
| | |- | | |- |
| − | | colspan="3" style="width: 250px; background-color: rgb(219, 229, 241)" | '''Capital''' | + | | colspan="3" style="width: 250px; background-color: rgb(219, 229, 241)" | '''Capital''' |
| − | | style="width: 250px; background-color: rgb(219, 229, 241)" | New Delhi (28° 36′ 50″ N, 77° 12′ 32″ E) | + | | style="width: 250px; background-color: rgb(219, 229, 241)" | New Delhi (28° 36′ 50″ N, 77° 12′ 32″ E) |
| | |- | | |- |
| − | | colspan="3" style="width: 250px; background-color: rgb(219, 229, 241)" | '''Official Languages(s)''' | + | | colspan="3" style="width: 250px; background-color: rgb(219, 229, 241)" | '''Official Languages(s)''' |
| − | | style="width: 250px; background-color: rgb(219, 229, 241)" | | + | | style="width: 250px; background-color: rgb(219, 229, 241)" | |
| | Hindi, English | | Hindi, English |
| | | | |
| | |- | | |- |
| − | | colspan="3" style="width: 250px; background-color: rgb(219, 229, 241)" | '''Government''' | + | | colspan="3" style="width: 250px; background-color: rgb(219, 229, 241)" | '''Government''' |
| − | | style="width: 250px; background-color: rgb(219, 229, 241)" | Federal parliamentary constitutional republic | + | | style="width: 250px; background-color: rgb(219, 229, 241)" | Federal parliamentary constitutional republic |
| | |- | | |- |
| − | | colspan="3" style="width: 250px; background-color: rgb(219, 229, 241)" | '''President''' | + | | colspan="3" style="width: 250px; background-color: rgb(219, 229, 241)" | '''President''' |
| − | | style="width: 250px; background-color: rgb(219, 229, 241)" | Pranab Mukherjee<ref name="http://en.wikipedia.org/wiki/India">http://en.wikipedia.org/wiki/India</ref> | + | | style="width: 250px; background-color: rgb(219, 229, 241)" | Pranab Mukherjee<ref name="http://en.wikipedia.org/wiki/India">http://en.wikipedia.org/wiki/India</ref> |
| | |- | | |- |
| − | | colspan="3" style="width: 250px; background-color: rgb(219, 229, 241)" | '''Prime Minister''' | + | | colspan="3" style="width: 250px; background-color: rgb(219, 229, 241)" | '''Prime Minister''' |
| − | | style="width: 250px; background-color: rgb(219, 229, 241)" | Manmohan Singh<ref name="http://en.wikipedia.org/wiki/India">http://en.wikipedia.org/wiki/India</ref> | + | | style="width: 250px; background-color: rgb(219, 229, 241)" | Manmohan Singh<ref name="http://en.wikipedia.org/wiki/India">http://en.wikipedia.org/wiki/India</ref> |
| | |- | | |- |
| − | | colspan="3" style="width: 250px; background-color: rgb(219, 229, 241)" | '''Total Area ''''''<span style="line-height: 21px">( </span>km²<span style="line-height: 21px">)</span>''' | + | | colspan="3" style="width: 250px; background-color: rgb(219, 229, 241)" | '''Total Area ''''''<span style="line-height: 21px">( </span>km²<span style="line-height: 21px">)</span>''' |
| − | | style="width: 250px; background-color: rgb(219, 229, 241)" | 3,287,590<ref>http://en.wikipedia.org/wiki/India</ref> | + | | style="width: 250px; background-color: rgb(219, 229, 241)" | 3,287,590<ref>http://en.wikipedia.org/wiki/India</ref> |
| | |- | | |- |
| − | | colspan="3" style="width: 250px; background-color: rgb(219, 229, 241)" | '''Population''' | + | | colspan="3" style="width: 250px; background-color: rgb(219, 229, 241)" | '''Population''' |
| − | | style="width: 250px; background-color: rgb(219, 229, 241)" | 1,210,193,422 (2011 estimate) | + | | style="width: 250px; background-color: rgb(219, 229, 241)" | 1,210,193,422 (2011 estimate) |
| | |- | | |- |
| − | | colspan="3" style="width: 250px; background-color: rgb(219, 229, 241)" | '''Rural Population''' | + | | colspan="3" style="width: 250px; background-color: rgb(219, 229, 241)" | '''Rural Population''' |
| − | | style="width: 250px; background-color: rgb(219, 229, 241)" | <br/> | + | | style="width: 250px; background-color: rgb(219, 229, 241)" | <br/> |
| | |- | | |- |
| − | | colspan="3" style="width: 250px; background-color: rgb(219, 229, 241)" | '''GDP (Nominal)''' | + | | colspan="3" style="width: 250px; background-color: rgb(219, 229, 241)" | '''GDP (Nominal)''' |
| − | | style="width: 250px; background-color: rgb(219, 229, 241)" | $1.538 trillion (2010 estimate) | + | | style="width: 250px; background-color: rgb(219, 229, 241)" | $1.538 trillion (2010 estimate) |
| | |- | | |- |
| − | | colspan="3" style="width: 250px; background-color: rgb(219, 229, 241)" | '''GDP Per Capita''' | + | | colspan="3" style="width: 250px; background-color: rgb(219, 229, 241)" | '''GDP Per Capita''' |
| − | | style="width: 250px; background-color: rgb(219, 229, 241)" | $1,265 (2010 estimate) | + | | style="width: 250px; background-color: rgb(219, 229, 241)" | $1,265 (2010 estimate) |
| | |- | | |- |
| − | | colspan="3" style="width: 250px; background-color: rgb(219, 229, 241)" | '''Currency''' | + | | colspan="3" style="width: 250px; background-color: rgb(219, 229, 241)" | '''Currency''' |
| − | | style="width: 250px; background-color: rgb(219, 229, 241)" | Indian rupee (INR) | + | | style="width: 250px; background-color: rgb(219, 229, 241)" | Indian rupee (INR) |
| | |- | | |- |
| − | | colspan="3" style="width: 250px; background-color: rgb(219, 229, 241)" | '''Time Zone''' | + | | colspan="3" style="width: 250px; background-color: rgb(219, 229, 241)" | '''Time Zone''' |
| − | | style="width: 250px; background-color: rgb(219, 229, 241)" | IST (UTC+05:30) | + | | style="width: 250px; background-color: rgb(219, 229, 241)" | IST (UTC+05:30) |
| | |- | | |- |
| − | | colspan="3" style="width: 250px; background-color: rgb(219, 229, 241)" | '''Calling Code''' | + | | colspan="3" style="width: 250px; background-color: rgb(219, 229, 241)" | '''Calling Code''' |
| − | | style="width: 250px; background-color: rgb(219, 229, 241)" | +91 | + | | style="width: 250px; background-color: rgb(219, 229, 241)" | +91 |
| | |- | | |- |
| − | | colspan="3" style="width: 250px; background-color: rgb(219, 229, 241)" | '''Electricity Generation''' | + | | colspan="3" style="width: 250px; background-color: rgb(219, 229, 241)" | '''Electricity Generation''' |
| − | | style="width: 250px; background-color: rgb(219, 229, 241)" | <span data-scaytid="5" data-scayt_word="twh">TWh</span>/year (year) | + | | style="width: 250px; background-color: rgb(219, 229, 241)" | <span data-scaytid="5" data-scayt_word="twh">TWh</span>/year (year) |
| | |- | | |- |
| − | | colspan="3" style="width: 250px; background-color: rgb(219, 229, 241)" | '''Access to Electricity''' | + | | colspan="3" style="width: 250px; background-color: rgb(219, 229, 241)" | '''Access to Electricity''' |
| − | | style="width: 250px; background-color: rgb(219, 229, 241)" | <br/> | + | | style="width: 250px; background-color: rgb(219, 229, 241)" | <br/> |
| | |- | | |- |
| − | | colspan="3" style="width: 250px; background-color: rgb(219, 229, 241)" | '''Wind energy (installed capacity)''' | + | | colspan="3" style="width: 250px; background-color: rgb(219, 229, 241)" | '''Wind energy (installed capacity)''' |
| − | | style="width: 250px; background-color: rgb(219, 229, 241)" | MW (year) | + | | style="width: 250px; background-color: rgb(219, 229, 241)" | MW (year) |
| | |- | | |- |
| − | | colspan="3" style="width: 250px; background-color: rgb(219, 229, 241)" | '''Solar Energy (installed capacity)''' | + | | colspan="3" style="width: 250px; background-color: rgb(219, 229, 241)" | '''Solar Energy (installed capacity)''' |
| − | | style="width: 250px; background-color: rgb(219, 229, 241)" | MW (year) | + | | style="width: 250px; background-color: rgb(219, 229, 241)" | MW (year) |
| | |} | | |} |
| | | | |
| Line 85: |
Line 85: |
| | India has a population of over 1.21 billion (2011 census). Out of these 1210 million people, 396 million (44.7% of the total rural population compared to 7.3% of urban population) does not have access to electricity and 592 million (rural- 62.5%; urban- 20.1%) people still use firewood for cooking . Majority of these people reside in rural areas and are still dependent on non-commercial energy sources, such as fuel wood, crop residue, and animal waste for their energy needs. Furthermore, about 80% of the population - which includes 28% of urban inhabitants - still relies on combustion of biomass fuels for cooking activities. The use of biomass for cooking also contributes to the indoor air pollution phenomenon, which caused 488.200 deaths in 2004 .<br/> | | India has a population of over 1.21 billion (2011 census). Out of these 1210 million people, 396 million (44.7% of the total rural population compared to 7.3% of urban population) does not have access to electricity and 592 million (rural- 62.5%; urban- 20.1%) people still use firewood for cooking . Majority of these people reside in rural areas and are still dependent on non-commercial energy sources, such as fuel wood, crop residue, and animal waste for their energy needs. Furthermore, about 80% of the population - which includes 28% of urban inhabitants - still relies on combustion of biomass fuels for cooking activities. The use of biomass for cooking also contributes to the indoor air pollution phenomenon, which caused 488.200 deaths in 2004 .<br/> |
| | | | |
| − | == Energy Supply<br/> ==
| + | = Energy Situation<br/> = |
| | | | |
| | For the past two decades, India has had to face increasing deficit in power supply, both for meeting its normal energy requirements as well as its peak load demand. The problem is acute during peak hours and summers, and necessitates planned load shedding by many utilities to maintain the grid in a healthy state. The average all-India shortages in 2009-10 were at 10 per cent in terms of normal energy requirement and about 13 per cent in terms of peak load. | | For the past two decades, India has had to face increasing deficit in power supply, both for meeting its normal energy requirements as well as its peak load demand. The problem is acute during peak hours and summers, and necessitates planned load shedding by many utilities to maintain the grid in a healthy state. The average all-India shortages in 2009-10 were at 10 per cent in terms of normal energy requirement and about 13 per cent in terms of peak load. |
| Line 93: |
Line 93: |
| | '''Electricity Demand and Supply'''<ref name="CEA">CEA</ref><br/> | | '''Electricity Demand and Supply'''<ref name="CEA">CEA</ref><br/> |
| | | | |
| − | {| border="1" align="center" cellspacing="0" cellpadding="0" style="width: 100%; height: 229px" | + | {| border="1" align="center" cellspacing="0" cellpadding="0" style="width: 100%; height: 229px" |
| | |- | | |- |
| − | | style="vertical-align: top; width: 70px" rowspan="3" | <p style="text-align: center">FY</p> | + | | style="vertical-align: top; width: 70px" rowspan="3" | <p style="text-align: center">FY</p> |
| − | | style="vertical-align: top; width: 290px" colspan="4" | <p style="text-align: center">Energy</p> | + | | style="vertical-align: top; width: 290px" colspan="4" | <p style="text-align: center">Energy</p> |
| − | | style="vertical-align: top; width: 279px" colspan="4" | <p style="text-align: center">Peak Demand</p> | + | | style="vertical-align: top; width: 279px" colspan="4" | <p style="text-align: center">Peak Demand</p> |
| | |- | | |- |
| − | | style="vertical-align: top; width: 290px" colspan="4" | <p style="text-align: center">(MU)</p> | + | | style="vertical-align: top; width: 290px" colspan="4" | <p style="text-align: center">(MU)</p> |
| − | | style="vertical-align: top; width: 279px" colspan="4" | <p style="text-align: center">(MW)</p> | + | | style="vertical-align: top; width: 279px" colspan="4" | <p style="text-align: center">(MW)</p> |
| | |- | | |- |
| − | | style="vertical-align: top; width: 71px; text-align: center" | Demand<br/> | + | | style="vertical-align: top; width: 71px; text-align: center" | Demand<br/> |
| − | | style="vertical-align: top; width: 80px; text-align: center" | Availability | + | | style="vertical-align: top; width: 80px; text-align: center" | Availability |
| − | | style="vertical-align: top; width: 71px; text-align: center" | Shortage | + | | style="vertical-align: top; width: 71px; text-align: center" | Shortage |
| − | | style="vertical-align: top; width: 68px; text-align: center" | % | + | | style="vertical-align: top; width: 68px; text-align: center" | % |
| − | | style="vertical-align: top; width: 71px; text-align: center" | Demand | + | | style="vertical-align: top; width: 71px; text-align: center" | Demand |
| − | | style="vertical-align: top; width: 69px; text-align: center" | Met | + | | style="vertical-align: top; width: 69px; text-align: center" | Met |
| − | | style="vertical-align: top; width: 71px; text-align: center" | Shortage | + | | style="vertical-align: top; width: 71px; text-align: center" | Shortage |
| − | | style="vertical-align: top; width: 68px; text-align: center" | % | + | | style="vertical-align: top; width: 68px; text-align: center" | % |
| | |- | | |- |
| − | | style="vertical-align: top; width: 70px; text-align: center" | 2002-03<br/> | + | | style="vertical-align: top; width: 70px; text-align: center" | 2002-03<br/> |
| − | | style="vertical-align: top; width: 71px; text-align: center" | 545,983 | + | | style="vertical-align: top; width: 71px; text-align: center" | 545,983 |
| − | | style="vertical-align: top; width: 80px; text-align: center" | 497,890 | + | | style="vertical-align: top; width: 80px; text-align: center" | 497,890 |
| − | | style="vertical-align: top; width: 71px; text-align: center" | 48,093 | + | | style="vertical-align: top; width: 71px; text-align: center" | 48,093 |
| − | | style="vertical-align: top; width: 68px; text-align: center" | 8.8 | + | | style="vertical-align: top; width: 68px; text-align: center" | 8.8 |
| − | | style="vertical-align: top; width: 71px; text-align: center" | 81,492 | + | | style="vertical-align: top; width: 71px; text-align: center" | 81,492 |
| − | | style="vertical-align: top; width: 69px; text-align: center" | 71,547 | + | | style="vertical-align: top; width: 69px; text-align: center" | 71,547 |
| − | | style="vertical-align: top; width: 71px; text-align: center" | 9,945 | + | | style="vertical-align: top; width: 71px; text-align: center" | 9,945 |
| − | | style="vertical-align: top; width: 68px; text-align: center" | 12.2<br/> | + | | style="vertical-align: top; width: 68px; text-align: center" | 12.2<br/> |
| | |- | | |- |
| − | | style="vertical-align: top; width: 70px; text-align: center" | 2003-04<br/> | + | | style="vertical-align: top; width: 70px; text-align: center" | 2003-04<br/> |
| − | | style="vertical-align: top; width: 71px; text-align: center" | 559,264 | + | | style="vertical-align: top; width: 71px; text-align: center" | 559,264 |
| − | | style="vertical-align: top; width: 80px; text-align: center" | 519,398<br/> | + | | style="vertical-align: top; width: 80px; text-align: center" | 519,398<br/> |
| − | | style="vertical-align: top; width: 71px; text-align: center" | 39,866 | + | | style="vertical-align: top; width: 71px; text-align: center" | 39,866 |
| − | | style="vertical-align: top; width: 68px; text-align: center" | 7.1 | + | | style="vertical-align: top; width: 68px; text-align: center" | 7.1 |
| − | | style="vertical-align: top; width: 71px; text-align: center" | 84,574 | + | | style="vertical-align: top; width: 71px; text-align: center" | 84,574 |
| − | | style="vertical-align: top; width: 69px; text-align: center" | 75,066 | + | | style="vertical-align: top; width: 69px; text-align: center" | 75,066 |
| − | | style="vertical-align: top; width: 71px; text-align: center" | 9,508 | + | | style="vertical-align: top; width: 71px; text-align: center" | 9,508 |
| − | | style="vertical-align: top; width: 68px; text-align: center" | 11.2 | + | | style="vertical-align: top; width: 68px; text-align: center" | 11.2 |
| | |- | | |- |
| − | | style="vertical-align: top; width: 70px; text-align: center" | 2004-05 | + | | style="vertical-align: top; width: 70px; text-align: center" | 2004-05 |
| − | | style="vertical-align: top; width: 71px; text-align: center" | 591,373 | + | | style="vertical-align: top; width: 71px; text-align: center" | 591,373 |
| − | | style="vertical-align: top; width: 80px; text-align: center" | 548,115 | + | | style="vertical-align: top; width: 80px; text-align: center" | 548,115 |
| − | | style="vertical-align: top; width: 71px; text-align: center" | 43,258 | + | | style="vertical-align: top; width: 71px; text-align: center" | 43,258 |
| − | | style="vertical-align: top; width: 68px; text-align: center" | 7.3 | + | | style="vertical-align: top; width: 68px; text-align: center" | 7.3 |
| − | | style="vertical-align: top; width: 71px; text-align: center" | 87,906 | + | | style="vertical-align: top; width: 71px; text-align: center" | 87,906 |
| − | | style="vertical-align: top; width: 69px; text-align: center" | 77,652 | + | | style="vertical-align: top; width: 69px; text-align: center" | 77,652 |
| − | | style="vertical-align: top; width: 71px; text-align: center" | 10,254 | + | | style="vertical-align: top; width: 71px; text-align: center" | 10,254 |
| − | | style="vertical-align: top; width: 68px; text-align: center" | 11.7 | + | | style="vertical-align: top; width: 68px; text-align: center" | 11.7 |
| | |- | | |- |
| − | | style="vertical-align: top; width: 70px; text-align: center" | 2005-06 | + | | style="vertical-align: top; width: 70px; text-align: center" | 2005-06 |
| − | | style="vertical-align: top; width: 71px; text-align: center" | 631,024 | + | | style="vertical-align: top; width: 71px; text-align: center" | 631,024 |
| − | | style="vertical-align: top; width: 80px; text-align: center" | 578,511 | + | | style="vertical-align: top; width: 80px; text-align: center" | 578,511 |
| − | | style="vertical-align: top; width: 71px; text-align: center" | 52,513 | + | | style="vertical-align: top; width: 71px; text-align: center" | 52,513 |
| − | | style="vertical-align: top; width: 68px; text-align: center" | 8.3 | + | | style="vertical-align: top; width: 68px; text-align: center" | 8.3 |
| − | | style="vertical-align: top; width: 71px; text-align: center" | 93,214 | + | | style="vertical-align: top; width: 71px; text-align: center" | 93,214 |
| − | | style="vertical-align: top; width: 69px; text-align: center" | 81,792 | + | | style="vertical-align: top; width: 69px; text-align: center" | 81,792 |
| − | | style="vertical-align: top; width: 71px; text-align: center" | 11,422 | + | | style="vertical-align: top; width: 71px; text-align: center" | 11,422 |
| − | | style="vertical-align: top; width: 68px; text-align: center" | 12.3 | + | | style="vertical-align: top; width: 68px; text-align: center" | 12.3 |
| | |- | | |- |
| − | | style="vertical-align: top; width: 70px; text-align: center" | 2006-07 | + | | style="vertical-align: top; width: 70px; text-align: center" | 2006-07 |
| − | | style="vertical-align: top; width: 71px; text-align: center" | 693,057 | + | | style="vertical-align: top; width: 71px; text-align: center" | 693,057 |
| − | | style="vertical-align: top; width: 80px; text-align: center" | 624,716 | + | | style="vertical-align: top; width: 80px; text-align: center" | 624,716 |
| − | | style="vertical-align: top; width: 71px; text-align: center" | 68,341 | + | | style="vertical-align: top; width: 71px; text-align: center" | 68,341 |
| − | | style="vertical-align: top; width: 68px; text-align: center" | 9.9 | + | | style="vertical-align: top; width: 68px; text-align: center" | 9.9 |
| − | | style="vertical-align: top; width: 71px; text-align: center" | 100,715 | + | | style="vertical-align: top; width: 71px; text-align: center" | 100,715 |
| − | | style="vertical-align: top; width: 69px; text-align: center" | 86,818 | + | | style="vertical-align: top; width: 69px; text-align: center" | 86,818 |
| − | | style="vertical-align: top; width: 71px; text-align: center" | 13,897 | + | | style="vertical-align: top; width: 71px; text-align: center" | 13,897 |
| − | | style="vertical-align: top; width: 68px; text-align: center" | 13.8 | + | | style="vertical-align: top; width: 68px; text-align: center" | 13.8 |
| | |- | | |- |
| − | | style="vertical-align: top; width: 70px; text-align: center" | 2007-08 | + | | style="vertical-align: top; width: 70px; text-align: center" | 2007-08 |
| − | | style="vertical-align: top; width: 71px; text-align: center" | 737,052 | + | | style="vertical-align: top; width: 71px; text-align: center" | 737,052 |
| − | | style="vertical-align: top; width: 80px; text-align: center" | 664,660 | + | | style="vertical-align: top; width: 80px; text-align: center" | 664,660 |
| − | | style="vertical-align: top; width: 71px; text-align: center" | 72,392 | + | | style="vertical-align: top; width: 71px; text-align: center" | 72,392 |
| − | | style="vertical-align: top; width: 68px; text-align: center" | 9.8 | + | | style="vertical-align: top; width: 68px; text-align: center" | 9.8 |
| − | | style="vertical-align: top; width: 71px; text-align: center" | 108,866 | + | | style="vertical-align: top; width: 71px; text-align: center" | 108,866 |
| − | | style="vertical-align: top; width: 69px; text-align: center" | 90,793 | + | | style="vertical-align: top; width: 69px; text-align: center" | 90,793 |
| − | | style="vertical-align: top; width: 71px; text-align: center" | 18,073 | + | | style="vertical-align: top; width: 71px; text-align: center" | 18,073 |
| − | | style="vertical-align: top; width: 68px; text-align: center" | 16.6 | + | | style="vertical-align: top; width: 68px; text-align: center" | 16.6 |
| | |- | | |- |
| − | | style="vertical-align: top; width: 70px; text-align: center" | 2008-09 | + | | style="vertical-align: top; width: 70px; text-align: center" | 2008-09 |
| − | | style="vertical-align: top; width: 71px; text-align: center" | 777,039 | + | | style="vertical-align: top; width: 71px; text-align: center" | 777,039 |
| − | | style="vertical-align: top; width: 80px; text-align: center" | 691,038 | + | | style="vertical-align: top; width: 80px; text-align: center" | 691,038 |
| − | | style="vertical-align: top; width: 71px; text-align: center" | 86,001 | + | | style="vertical-align: top; width: 71px; text-align: center" | 86,001 |
| − | | style="vertical-align: top; width: 68px; text-align: center" | 11.1 | + | | style="vertical-align: top; width: 68px; text-align: center" | 11.1 |
| − | | style="vertical-align: top; width: 71px; text-align: center" | 109,809 | + | | style="vertical-align: top; width: 71px; text-align: center" | 109,809 |
| − | | style="vertical-align: top; width: 69px; text-align: center" | 96,785 | + | | style="vertical-align: top; width: 69px; text-align: center" | 96,785 |
| − | | style="vertical-align: top; width: 71px; text-align: center" | 13,024 | + | | style="vertical-align: top; width: 71px; text-align: center" | 13,024 |
| − | | style="vertical-align: top; width: 68px; text-align: center" | 11.9 | + | | style="vertical-align: top; width: 68px; text-align: center" | 11.9 |
| | |- | | |- |
| − | | style="vertical-align: top; width: 70px; text-align: center" | 2009-10 | + | | style="vertical-align: top; width: 70px; text-align: center" | 2009-10 |
| − | | style="vertical-align: top; width: 71px; text-align: center" | 830,594 | + | | style="vertical-align: top; width: 71px; text-align: center" | 830,594 |
| − | | style="vertical-align: top; width: 80px; text-align: center" | 746,644 | + | | style="vertical-align: top; width: 80px; text-align: center" | 746,644 |
| − | | style="vertical-align: top; width: 71px; text-align: center" | 83,950 | + | | style="vertical-align: top; width: 71px; text-align: center" | 83,950 |
| − | | style="vertical-align: top; width: 68px; text-align: center" | 10.1 | + | | style="vertical-align: top; width: 68px; text-align: center" | 10.1 |
| − | | style="vertical-align: top; width: 71px; text-align: center" | 118,472 | + | | style="vertical-align: top; width: 71px; text-align: center" | 118,472 |
| − | | style="vertical-align: top; width: 69px; text-align: center" | 102,725 | + | | style="vertical-align: top; width: 69px; text-align: center" | 102,725 |
| − | | style="vertical-align: top; width: 71px; text-align: center" | 15,747 | + | | style="vertical-align: top; width: 71px; text-align: center" | 15,747 |
| − | | style="vertical-align: top; width: 68px; text-align: center" | 13.3 | + | | style="vertical-align: top; width: 68px; text-align: center" | 13.3 |
| | |} | | |} |
| | | | |
| Line 198: |
Line 198: |
| | '''Generating capacity addition during the Tenth Plan (2002-2007) & Anticipated generating capacity by the end of the Eleventh plan (2007-2012) (in MW)'''<ref name="www.planning commission.nic.in">www.planning commission.nic.in</ref><br/> | | '''Generating capacity addition during the Tenth Plan (2002-2007) & Anticipated generating capacity by the end of the Eleventh plan (2007-2012) (in MW)'''<ref name="www.planning commission.nic.in">www.planning commission.nic.in</ref><br/> |
| | | | |
| − | {| border="1" align="center" cellspacing="1" cellpadding="1" style="height: 217px; width: 100%" | + | {| border="1" align="center" cellspacing="1" cellpadding="1" style="height: 217px; width: 100%" |
| | |- | | |- |
| | | | | | |
| Line 259: |
Line 259: |
| | The installed capacity of power plants in the country as on 29.02.2012 is 1,90,593 MW (including 22,253 MW from Renewable Energy Sources). The gross electricity generation in the country during 2011-12 <span style="font-family: monospace"><span style="font-family: sans-serif">(</span></span>up to February, 2012) including import from Bhutan was 798.9 Billion Units. The energy requirement, availability and shortage in the country during April, 2011 to February, 2012 are given below:<ref name="http://pib.nic.in/newsite/PrintRelease.aspx?relid=81243">http://pib.nic.in/newsite/PrintRelease.aspx?relid=81243</ref><br/> | | The installed capacity of power plants in the country as on 29.02.2012 is 1,90,593 MW (including 22,253 MW from Renewable Energy Sources). The gross electricity generation in the country during 2011-12 <span style="font-family: monospace"><span style="font-family: sans-serif">(</span></span>up to February, 2012) including import from Bhutan was 798.9 Billion Units. The energy requirement, availability and shortage in the country during April, 2011 to February, 2012 are given below:<ref name="http://pib.nic.in/newsite/PrintRelease.aspx?relid=81243">http://pib.nic.in/newsite/PrintRelease.aspx?relid=81243</ref><br/> |
| | | | |
| − | {| border="1" align="center" cellspacing="1" cellpadding="1" style="height: 146px; width: 100%" | + | {| border="1" align="center" cellspacing="1" cellpadding="1" style="height: 146px; width: 100%" |
| | |- | | |- |
| | | <p style="text-align: center">'''Year'''</p> | | | <p style="text-align: center">'''Year'''</p> |
| Line 697: |
Line 697: |
| | <references /><br/> | | <references /><br/> |
| | | | |
| − | [[Category:India]]
| |
| | [[Category:Country_Energy_Situation]] | | [[Category:Country_Energy_Situation]] |
| | + | [[Category:India]] |
India is a rapidly growing economy which needs energy to meet its growth objectives in a sustainable manner. The Indian economy faces significant challenges in terms of meeting its energy needs in the coming decade. The increasing energy requirements coupled with a slower than expected increase in domestic fuel production has meant that the extent of imports in energy mix is growing rapidly[3]. India is among the top five Green-house-gas (GHG) emitters globally[4]. To reduce its dependency on the conventional sources, India has launched a solar mission in 2009. The Mission has set a target of 20,000 MW using solar. Solar Mission stipulates implementation and achievementof the target in 3 phases (first phase upto 2012-13, second phase from 2013 to 2017 and the third phase from 2017 to2022) for various components, including grid connected solar power.[5]
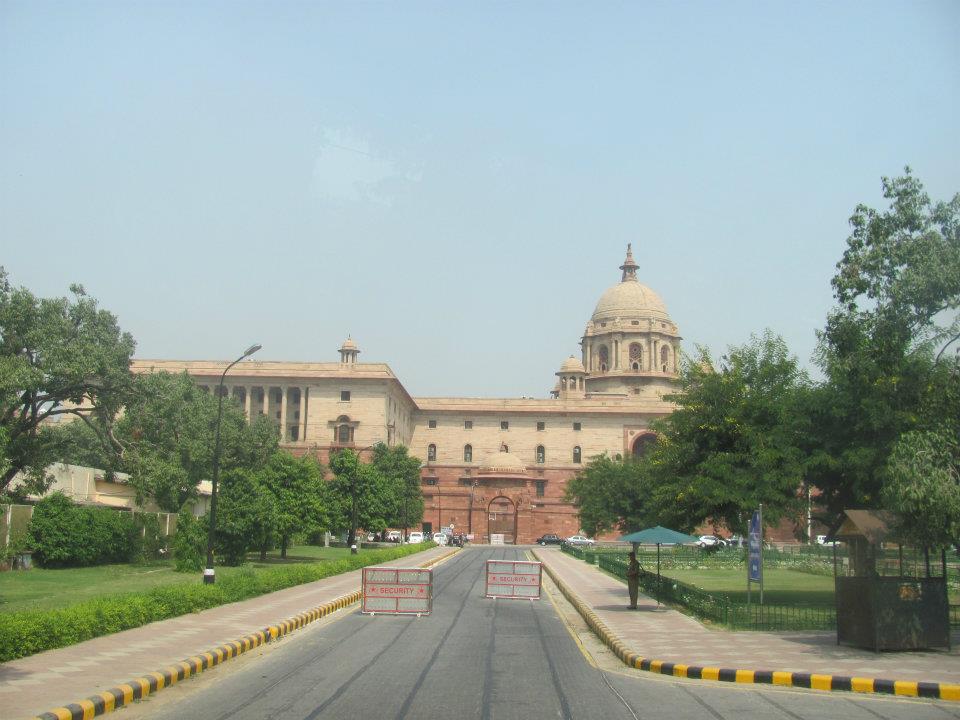
India is a federal constitutional Republic with 28 states and seven union territories. The official language is Hindi although every state has its own regional language. It is the 4th largest economy (based on GDP by Purchase Power Parity) in the world and 9th largest economy (based on GDP by nominal rate).
Electricity Consumption in India was about 543 KWh/capita in 2009, among the lowest in the world. Although India has considerably improved its generating capacity, it still has difficulty in meeting demand and there are persistent power shortages which constrain India’s economic growth. With the development of the industrial and commercial sectors as well as the wider use of electrical equipment, electricity demand keeps increasing.
Moreover, approximately 30 percent of India’s generated power is lost in transmission. Distribution is the weakest link of India’s power supply chain as it faces substantial technical losses (because of overloading of transformers and conductors, for instance) and commercial losses of electricity (because of low metering efficiency, poor billing and collection, large scale theft of power). Furthermore, lack of transmission and distribution of power to less densely populated areas which are located far away from the power generating stations is the major reason for not being able to achieve 100 percent electrification in the country.
In India, about 70% of the population lives in rural areas. In 2010, it was estimated that 48 percent of rural households were un-electrified nationally leaving approximately 400 Million People without electricity. Hence it is necessary to use energy sources which can be decentralized to supply power to these households[6].
India has a population of over 1.21 billion (2011 census). Out of these 1210 million people, 396 million (44.7% of the total rural population compared to 7.3% of urban population) does not have access to electricity and 592 million (rural- 62.5%; urban- 20.1%) people still use firewood for cooking . Majority of these people reside in rural areas and are still dependent on non-commercial energy sources, such as fuel wood, crop residue, and animal waste for their energy needs. Furthermore, about 80% of the population - which includes 28% of urban inhabitants - still relies on combustion of biomass fuels for cooking activities. The use of biomass for cooking also contributes to the indoor air pollution phenomenon, which caused 488.200 deaths in 2004 .
For the past two decades, India has had to face increasing deficit in power supply, both for meeting its normal energy requirements as well as its peak load demand. The problem is acute during peak hours and summers, and necessitates planned load shedding by many utilities to maintain the grid in a healthy state. The average all-India shortages in 2009-10 were at 10 per cent in terms of normal energy requirement and about 13 per cent in terms of peak load.
However, the Indian Power Ministry has been trying to increase its generating capacity by adding to it every year.
The installed capacity of power plants in the country as on 29.02.2012 is 1,90,593 MW (including 22,253 MW from Renewable Energy Sources). The gross electricity generation in the country during 2011-12 (up to February, 2012) including import from Bhutan was 798.9 Billion Units. The energy requirement, availability and shortage in the country during April, 2011 to February, 2012 are given below:[9]
Electricity is the most important component of primary energy.Access to affordable and reliable electricity is critical to a country’s growth and prosperity. The country has made significant progress towards the augmentation of its power infrastructure. In absolute terms, the installed power capacity has increased from only 1713 MW as on 31 December 1950 to 118 419 MW as on March 2005.
Rapid growth of the Indian economy places a heavy demand on electric power and this adds to the shortage of power already glaring at us. This shortage of power and lack of access acts as major constraints on the economic growth. Average peak shortages excluding scheduled load shedding was estimated at 12% and average energy shortages at 11 % in 2008-09. Power shortages hint towards an insufficient generating capacity and inadequate transmission and distribution networks. To a great extent this is the outcome of poor financial health of the State Electricity Utilities having high levels of Aggregate Technical and Commercial (AT&C) losses. AT&C losses of most of the State Power Utilities (SPUs) are currently high at above 35%. Due to this, these utilities have had only limited success in attracting private investors to set up power plants.[10]Moreover, poor quality of power supply and frequent power cuts and shortages impose a heavy burden on India’s fast-growing trade and industry. A crowd sourcing information webpage on power cuts in India has been in operation since 2011: [1]
In the recent years, India’s energy consumption has been increasing at one of the fastest rates in the world due to population growth and economic development. Industrial consumers are the largest group of electricity consumers, followed by the domestic, agricultural and commercial consumers, in that order.Primary commercial energy demand grew at the rate of six per cent between 1981 and 2001Unknown Object. India ranks fifth in the world in terms of primary energy consumption, accounting for about 3.5% of the world commercial energy demand in the year 2003 . Despite the overall increase in energy demand, per capita energy consumption in India is still very low (15.9 Million Btu) compared to other developing countries (Thailand: 57.9; China: 56.9)[11]
Despite increasing dependency on commercial fuels, a sizeable quantum of energy requirements (40% of total energy requirement), especially in the rural household sector, is met by non-commercial energy sources, which include fuel wood, crop residue, and animal waste, including human and draught animal power. However, other forms of commercial energy of a much higher quality and efficiency are steadily replacing the traditional energy resources being consumed in the rural sector.
Even the per capita electricity consumption rose from merely 15.6 kWh in 1950 to 592 kWh in 2003/04[12]However, it is a matter of concern that per capita consumption of electricity is among the lowest in the world.
India is a sovereign, secular and democratic republic with a parliamentary form of Government. It is the largest democracy in the world. The President is the Head of the state (Country) whereas Prime Minister is the Head of the Government .Legistlative powers is vested in the two chambers of Pariament of India “ The Lok Sabha- House of people or council of Ministers” and the Rajya Sabha “ The Council of States”. Similar structure in the state (province) governments where head of the state is the Governer and head of the state government is the Chief Minister. The Election takes place every 5 Years. India has a Three Tier Judiciary system- Supreme court, 21 High courts and large number of Trial courts. [13]
India has one of the highest potentials for harnessing the renewable energy as it is bestowed with such natural resources and geographical and climatic conditions that could support the promotion of renewable energy technologies like solar, wind, biomass and small hydro.
As on 31st January, 2012, the total installed capacity of grid connected Renewable Energy is 23.12 GW. Amongst this, the biggest chunk is from Wind power, which stands at around 16, 000 MW. The wind power sector growth in India is continuously increasing and around 2100 MW of wind power was added in the last year and it is expected to continue because of the continued government supported schemes in this sector.
Till last year, the share of grid connected Solar PV was negligible, only around 40 MW and most of the Government focus was on Off grid Solar PV and Residential Solar Thermal. However, due to the new government initiative- Jawaharlal Nehru National Solar Mission (announced in year 2010), the Grid connected Solar PV and the Concentrated Solar Power Market is on the boom. Around 440 MW of Solar PV was installed in the last year and is expected to increase many folds due to highly lucrative government schemes.
Small Hydro and Biomass technologies represent the remaining chunk of the Grid connected Renewable Energy mix, as shown in the graph below. Government also sees Geothermal Energy as an interesting Renewable Energy source for India and few sites in Andaman Nibobar Islands etc have been identified for the pilot projects.
As per the Indian Electricity Grid code 2010, it has been made mandatory for each Indian state to generate/ purchase a minimum amount of electricity through Renewable Energy (Renewable Energy Purchase Obligation). Further, each state utility has special schemes (preferential tariffs) for the purchase of Renewable Energy Electricity. For instance, the Feed in tariff of wind power varies from 4 Euro cents to 9 Euro cents depending on state to state and the wind power density in the state. Moreover, as per the CERC guideline, Solar and Wind power falls in MUST RUN category and they can be asked to shut only when there are security concerns for the Grid. Similary, each state has different schemes for different renewable energy source as per the potential of renewable energy source in the state. An overview of the wind power and Solar power scheme is given in the next section. [16]
India has high Solar Insolation levels with about 300 clear sunny days –most parts of the country receive 4-7 Kwh/m²/day with about 1500-2000 sunshine hours per-week (depending upon location ) , which is far more than current total energy consumption .
India is the world’s fifth largest producer of wind power after Denmark, Germany, Spain, and the USA[17] Reported installed capacity by Dec 2011: 16084 MW Ranked as the 5th country with the largest installed capacity. During the year 2011 India added 3019 MW of wind power.[18]
The potential for power production from captive and field-based biomass resources, using technologies for distributed power generation, is assessed at 19 500 MW including 3500 MW of exportable surplus power from </span>bagasse-based cogeneration in sugar mills.[19]
The capital cost for solar power has come down by about 16% to 20% in the last two years. It is expected to continue the downward trend for the next three years as the manufacturing scale increases and the technology matures. At the same time, the cost for fossil fuels such as coal is expected to increase and subsidies in the power sector in India are expected to fall, thus driving up grid power prices. Given India’s high irradiation levels, solar power will soon become a feasible choice for captive generation in the future. So it is expected that India will achieve Grid Parity in 2018. [24]
On the ground, the schemes would be implemented by franchisees working as distribution companies for the local communities by buying power from the SEBs / DISCOMs and selling it to the final customers. Under RGGVY, the MoP grants 90% of investment costs for rural electrification projects through REC. SEBs are supposed to come up with the remaining 10% of the cost either through their own funds, loans from the REC, or other institutions. Final consumers would need to pay connection fees; however, for households below the poverty line (“BPL Households”), no connection fee would be charged.
RGGVY aims to electrify 125,000 villages and connect the entire 23.4 million “below poverty line” households with free connection. RGGVY is also expected to augment the existing network in 462,000 electrified villages by 2010. While so far the grid extension schemes of RGGVY are advancing according to plan (489.532 villages electrified; 82.32% of target achieved), almost no schemes have been implemented under DDG.
It emphasizes on enhancement of technical capacity in the country by setting up state-of-the-art testing, certification and monitoring facilities and strengthening R&D programmes in key technical institutions. The dominating focus is put on health impacts by improving combustion efficiency, avoiding the generation of pollution. The considered stoves are therefore more sophisticated (e.g. centrally-manufactured gasifier stoves with forced draft through electric fans; require development of sophisticated supply chains since such materials and components mostly are developed by specialized firms) and expensive than in previous programmes.